Protein-to-Calorie Ratio Calculator
Enter any food's protein and calories to get its protein-to-calorie ratio - grams of protein per 1,000 kcal - then compare it against common foods or our database of 284 freeze-dried and dehydrated trail meals.
Affiliate disclosure: this page contains affiliate links. If you buy through one, FoodEverest may earn a commission at no extra cost to you, whether through the Amazon Associates Program or another brand's affiliate program. Full disclosure.
Calculate & compare
Enter a food's protein and calories, or pick one, to see its ratio and where it lands.
–
Nothing is sent anywhere - the calculation runs entirely in your browser. The benchmark scale is built from the published nutrition labels of all 284 meals in our database; common-food figures are approximate USDA values.
What is a good protein-to-calorie ratio?
There is no single "correct" number - it depends on what the food is for. A useful rule of thumb: when 20% or more of a food's calories come from protein - about 50 g of protein per 1,000 kcal - it counts as protein-rich. Lean whole proteins sit far higher: cooked shrimp and canned tuna both clear 200 g per 1,000 kcal (see the common-foods table below).
Trail meals land lower on purpose. A freeze-dried dinner has to be calorie-dense enough to fuel a full day of walking, so it carries fat and carbohydrate alongside its protein. Across our 284 meals the protein-to-calorie ratio runs from about 5 to 179 g per 1,000 kcal, and the median meal is about 45 g per 1,000 kcal (18% of calories from protein). Here is how the whole database splits:
So a trail meal at 50 g per 1,000 kcal already beats 60% of what is out there; anything 80 g and up is in the top 8%.
Protein-to-calorie ratio of common foods
Where everyday foods land, per 100 g, for comparison - lean seafood and poultry lead, plant proteins and starches trail. Tap any row to load it into the calculator above.
| Food per 100 g | Protein g/1k kcal | % cals | Protein g | Cals |
|---|---|---|---|---|
| Shrimp, cooked | 242 | 97% | 24 | 99 |
| Canned tuna, in water | 211 | 84% | 19 | 90 |
| Chicken breast, cooked | 188 | 75% | 31 | 165 |
| Greek yogurt, nonfat | 173 | 69% | 10.2 | 59 |
| Tofu, firm | 120 | 48% | 17.3 | 144 |
| Egg, hard-boiled | 81 | 33% | 12.6 | 155 |
| Lentils, cooked | 78 | 31% | 9 | 116 |
| Peanut butter | 37 | 15% | 22 | 588 |
| White rice, cooked | 21 | 8% | 2.7 | 130 |
Figures are approximate USDA FoodData Central values. Note how even the leanest trail meals rarely reach the level of plain shrimp or tuna - a cooked meal trades some protein density for the calories and fat that make it a full dinner.
The most protein-dense trail meals
The highest protein-to-calorie ratio in our database belongs to Packit Gourmet Kickin' Chicken Hot Wings Wrap: about 179 g of protein per 1,000 kcal (59 g of protein against 330 calories), roughly 4x the median meal. See every Packit Gourmet meal in our Packit Gourmet guide.
The five highest-ranking meals by protein-to-calorie ratio - the full list of 284, ranked, is in our high-protein roundup:
| # | Meal | Protein g/1k kcal | % cals | Protein g |
|---|---|---|---|---|
| 1 | 179 | 72% | 59 | |
| 2 | 127 | 51% | 22 | |
| 3 | 118 | 47% | 47 | |
| 4 | 112 | 45% | 46 | |
| 5 | 112 | 45% | 56 |
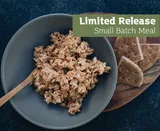
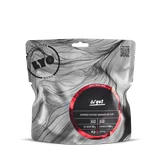
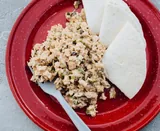
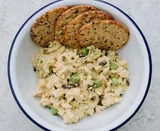
Want the whole trip planned around a protein target instead of one meal? Build a food list in the trip planner, or compare meals on weight in the calorie-density ranking.
How this is calculated
Protein-to-calorie ratio = protein (g) ÷ calories × 1,000, using each brand's own published nutrition label across our 284 freeze-dried and dehydrated meals from 14 brands, captured 2026-07-28. We rank on protein per 1,000 kcal, not raw grams, so a bigger pouch can't win just for being bigger - the ratio is the fair, size-independent comparison. Common-food figures are approximate USDA FoodData Central values, per 100 g. Prices and specs are not live; we link to brand and retailer pages so you can confirm before buying. No brand paid for placement.